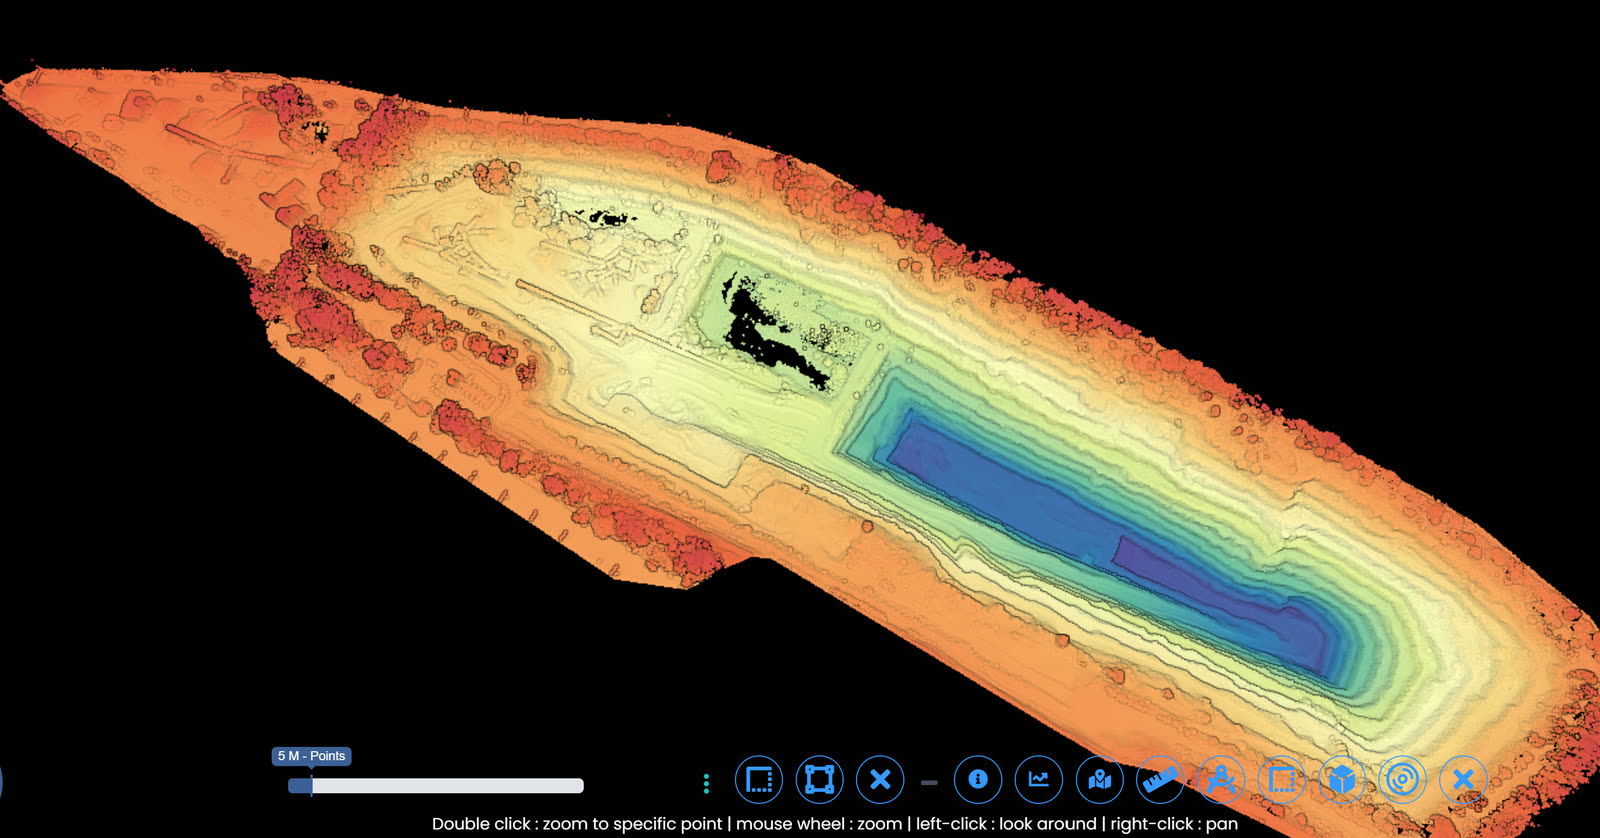







Specialised Service

Blast Fragmentation Analysis

Measured particle size distribution from every blast, not an estimate from the pit floor. Drone capture and automated image analysis give you the oversize rate, the size curve and the muck pile profile, so blast design is tuned against evidence.

Trusted by
Sibanye-Stillwater Eskom Grindrod Debswana TotalEnergies

Fragmentation is the quiet cost centre of a mining operation. Poor fragmentation is not usually visible as a single failure. It shows up downstream as slower loading, higher wear on crushers and mills, more secondary breaking, and energy consumed reducing rock that the blast should have reduced for free. By the time it reaches the plant, the cost has been absorbed into a dozen other line items and no longer looks like a blasting problem.

The obstacle has always been measurement. Judging a muck pile by eye is subjective, varies between shift bosses, and cannot be trended. Delta Scan measures it instead. We capture the muck pile with drone video and imagery, process it through automated fragmentation analysis, and return a particle size distribution curve with the oversize percentage stated against your own threshold. The result is a number that can be compared blast to blast, bench to bench, and contractor to contractor.
When to use it

Typical engagements.

Each scenario below represents a real-world trigger for this service. If your situation matches one of these, get in touch.

Tuning a blast design

Changing burden, spacing, timing or powder factor without measuring the result is guesswork. Fragmentation analysis closes the loop, so a design change can be judged on the size curve it actually produced.

Downstream throughput is short of plan

When crusher throughput, mill power draw or loader cycle times are worse than design, oversize from the blast is a common cause and one of the cheapest to correct once it is measured.

Holding a drilling and blasting contractor to a specification

A fragmentation specification is only enforceable if it is measured consistently. An independent size distribution gives both parties the same number to work from.

Secondary breaking costs are climbing

Rock breaker hours, boulder handling and re-blasting are direct consequences of oversize. Quantifying the oversize rate makes the trade-off against powder factor an arithmetic decision.

How it works

Our process.

A repeatable five-stage workflow. The same disciplined sequence runs whether the site is a 500-hectare mining operation or a single 60-metre bridge.

01

Define the threshold that matters

Oversize is only meaningful against a limit. We agree the size that is oversize for your crusher gape or shovel bucket, and the size fractions you want reported, before the first blast is captured.

02

Capture the muck pile

The pile is captured by drone with a consistent standoff and scale reference, so results are comparable between blasts rather than sensitive to how the imagery happened to be taken.

03

Automated fragmentation analysis

Imagery is processed through fragmentation analysis software that delineates individual fragments and builds the size distribution across the exposed face of the pile.

04

Engineering review

Automated results are reviewed rather than issued raw. Fines, shadowing and areas where the analysis is unreliable are identified and excluded so the reported curve is defensible.

05

Report and trend

You receive the size distribution curve, the oversize percentage against your threshold, key percentile sizes, and the muck pile profile. Repeat blasts are trended so the effect of design changes is visible over time.

Request a fragmentation analysis See drone survey
Equipment

What we use.

Calibrated, sector-matched hardware combined with proprietary software. The capture stack is selected for the asset, not the other way around.

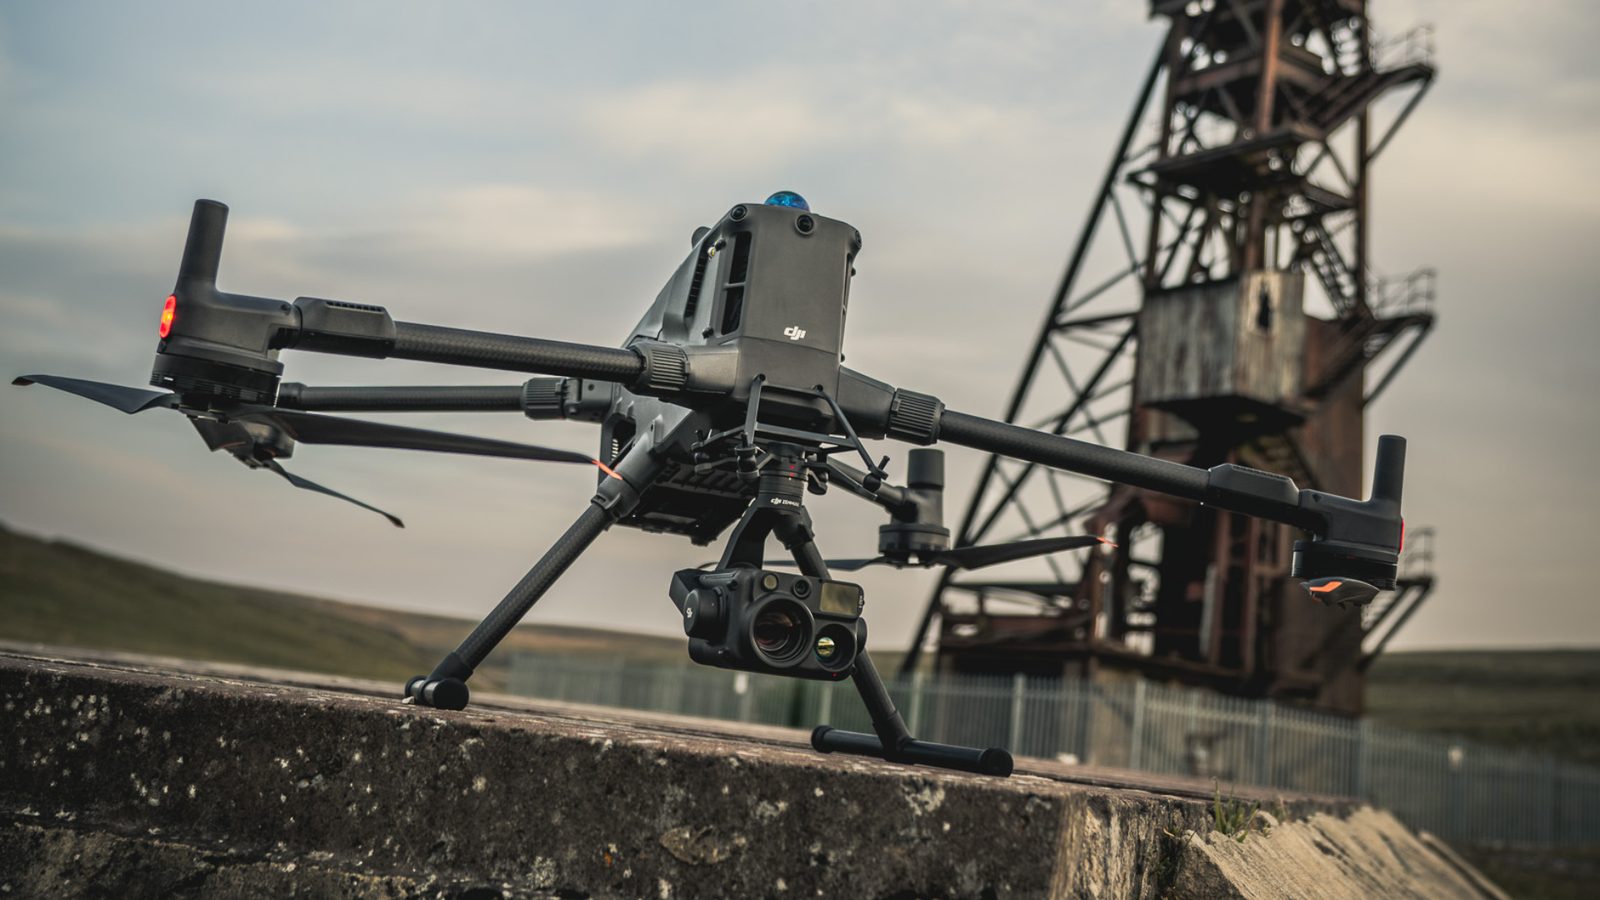
DJI Matrice 400

DJI Matrice 400

Primary capture platform for muck pile imagery and video at consistent standoff over an active bench

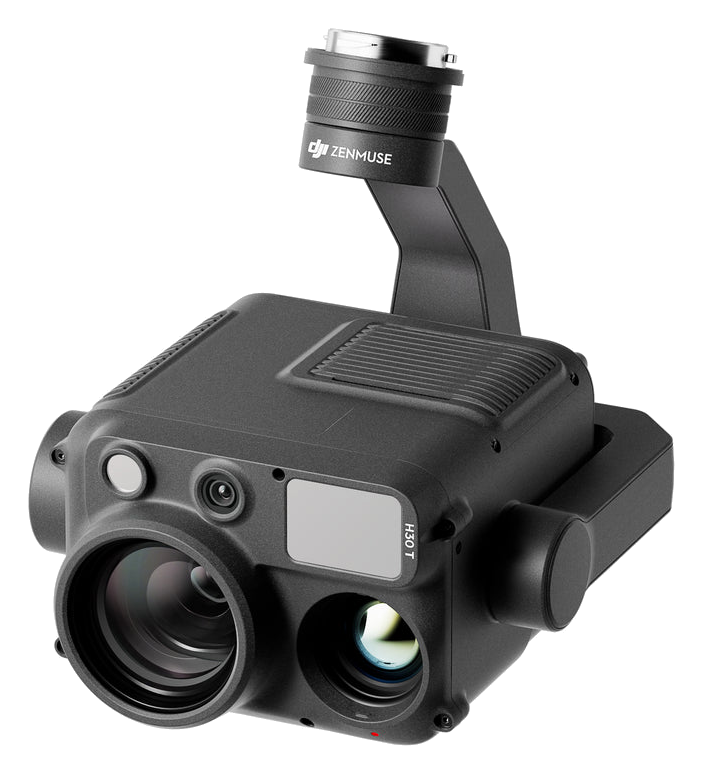
DJI Zenmuse H30T

DJI Zenmuse H30T

High-resolution imaging payload for fragment delineation across the exposed pile face

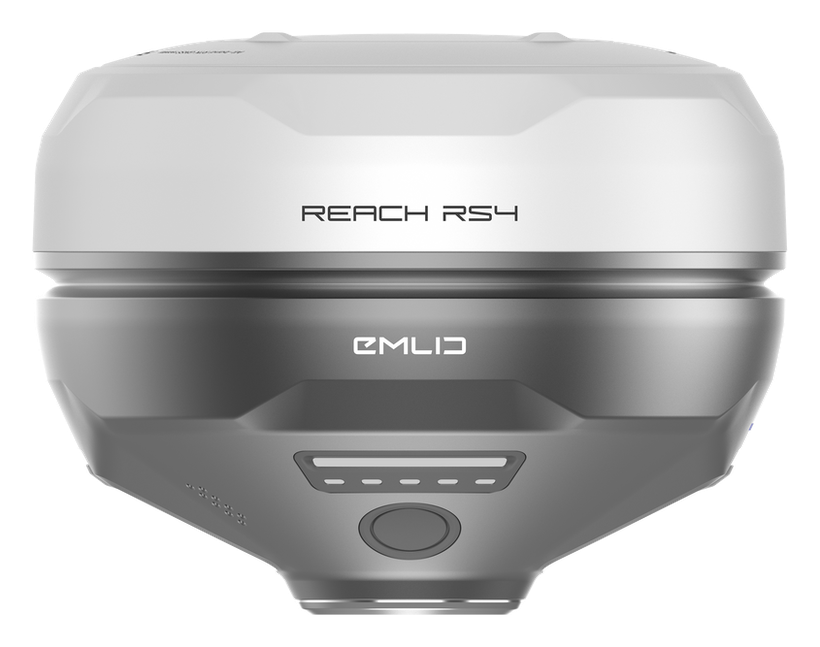
Emlid RS4

Emlid RS4

RTK GNSS control so pile volume and profile tie to real site coordinates alongside the size analysis

Sectors

Where this fits.

The same engineering discipline applies across Open pit mining, Quarrying and aggregates, Contract drilling and blasting, Processing and metallurgy. The detail changes with the asset class and the operational context.

Open pit mining

Bench-by-bench fragmentation trending, powder factor optimisation, and oversize control ahead of primary crushing.

Quarrying and aggregates

Product size yield, oversize reduction, and blast design tuning where the fragmentation is itself close to the saleable product.

Contract drilling and blasting

Independent verification of fragmentation against a contracted specification, measured the same way on every blast.

Processing and metallurgy

Feed size characterisation for crusher and mill performance investigations, linking plant throughput back to the blast that produced the feed.

FAQ

Frequent questions.

Direct answers to the questions clients ask most often before engaging.

How accurate is image-based fragmentation analysis?

It measures the exposed surface of the muck pile, which is the practical basis for every image-based method. It is highly repeatable, which is what matters most: the value is in comparing blast to blast under a consistent capture and processing method. We state the limitations of each analysis on the report rather than presenting a single number without context.

Can you analyse fines?

Fine material below the resolution of the imagery cannot be delineated reliably, and we do not pretend otherwise. The reported curve is most reliable in the mid and coarse fractions, which is where oversize decisions are made. Where the fines fraction is the commercial question, it needs sampling and sieving rather than imagery.

Do you need to stop production to capture a blast?

No. Capture is done from the air with no personnel on the pile and typically takes minutes. It is scheduled around the loading fleet rather than interrupting it.

Can this be done on historical blasts?

Only if imagery of the muck pile exists and includes a usable scale reference. Without a known scale in frame, fragment sizes cannot be established. Going forward we set the capture standard so every blast is comparable.

How does this compare to sieving?

Sieving is the reference method and remains more accurate for a sampled volume, but it is slow, destructive of the sample, and impractical to run on every blast. Image analysis is not a replacement for sieving in a metallurgical context. It is the practical way to measure every blast rather than a handful per year.

Related services

If this fits, these often do too.

Engineering programmes rarely run on a single service. These adjacent capabilities most often pair with the work above.

Accuracy & standards

Built to be signed, not just shared.

Pr EngECSA 202001436

Every engineering deliverable is reviewed and signed by Darryl Epstein, a registered Professional Engineer (Pr Eng, ECSA 202001436).

SAGIsurvey

Geospatial deliverables carry registered land-surveyor sign-off where accuracy must be certified.

Classstated

Every deliverable carries a stated survey accuracy class or BIM level of development (LOD), reported per engagement against check-point analysis.

Standardscited

Findings cross-referenced to the applicable codes (SANS, TMH, EN), with accuracy statements on every report.

Start here

Request a fragmentation analysis

Send the brief and our engineering team will review your enquiry and reply within one business day. Prefer to talk first? Call or WhatsApp us below.

Response within 1 business day · Pr Eng or SAGI signed

Start a project Call